Edit Data
Moabi uses iD to edit existing data. With iD, users can update map feature attributes, add new attributes to features, improve the geometry of features, and even add new hand-drawn features. All edits happen within the browser, so as long as your browser is up to date, you will not need to download any additional software.
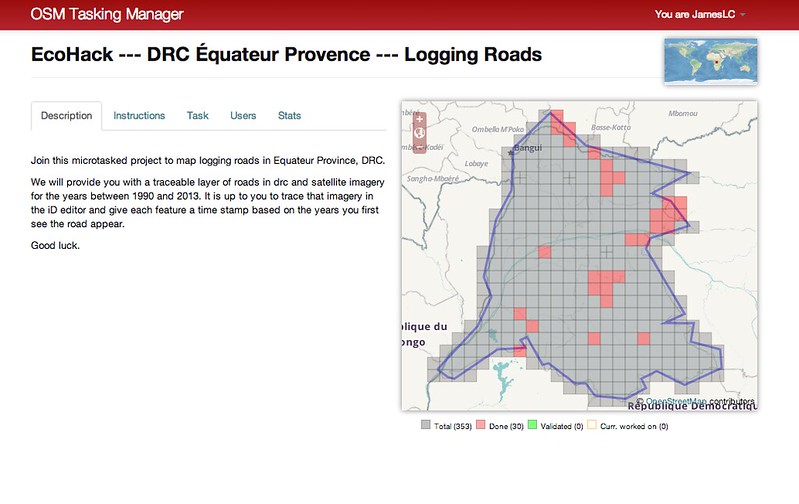
For the EcoHackathon, we are using another OSM tool, the Tasking Manager to microtask the work. To begin with, go to the Tasking Manager to be assigned a task.

Click Log In Using Your OpenStreetMap Account. If you’ve never used OSM before, click Register Now and confirm by email. Finally, authorize the Tasking Manager to access your account.
OSM Tasking Manager
The Tasking Manager is used to break up very large mapping projects into small pieces that can be microtasked across many members of a group. The gridded map on the right displays the entire area of interest broken up into grid cells. Gray cells have not yet been worked on; Yellow cells are being edited; Red cells have been mapped; and Green cells have been validated.

To get started, click a gray square that has not yet been worked on. You will be presented with a series of editors to map that cell. For this exercise, we are using the in-browser iD editor. Click Yes, I want to work on this task to be assigned this task.

-
First download your grid cell’s bounding box as a
.gpxfile. Right click the .gpx button and save it to your hard drive. -
Next, click iD Editor to go to iD.
Move from OSM to Moabi
Welcome to OSM’s iD Editor. However, for the EcoHack, we will be working within Moabi’s iD clone, so first we must change the URL slightly. Your URL will look something like this:
http://www.openstreetmap.org/edit?editor=id#map=10/3.6888/18.8086
Change www.openstreetmap to dev.osm.moabi, so that your full URL looks something like this:
http://dev.osm.moabi.org/edit?editor=id#map=10/3.6888/18.8086
iD
You will now be asked to create another account for Moabi. Follow the same process you did to sign up for OSM (use the same name and password, if that’s easier to remember), and confirm by email.
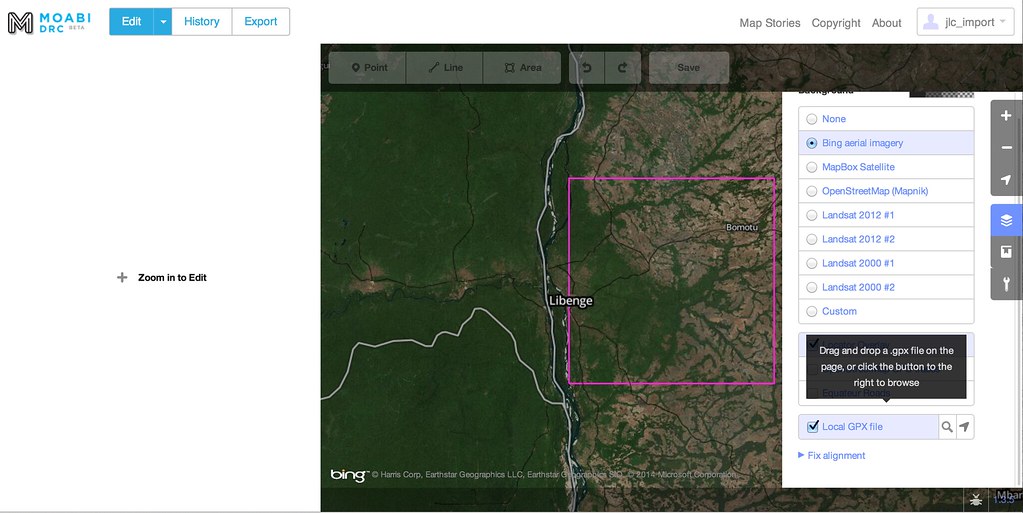
Once you are back in the Moabi iD editor, you can reupload the .gpx file you downloaded from the OSM iD editor. Click the layers tab to open the layer chooser, and at the bottom, find the Local GPX file button. Either drag and drop your local .gpx file or browse for it on your hard drive.

You should now see your grid cell outlined in purple. Everything within that box is yours to work on.
Navigating in iD
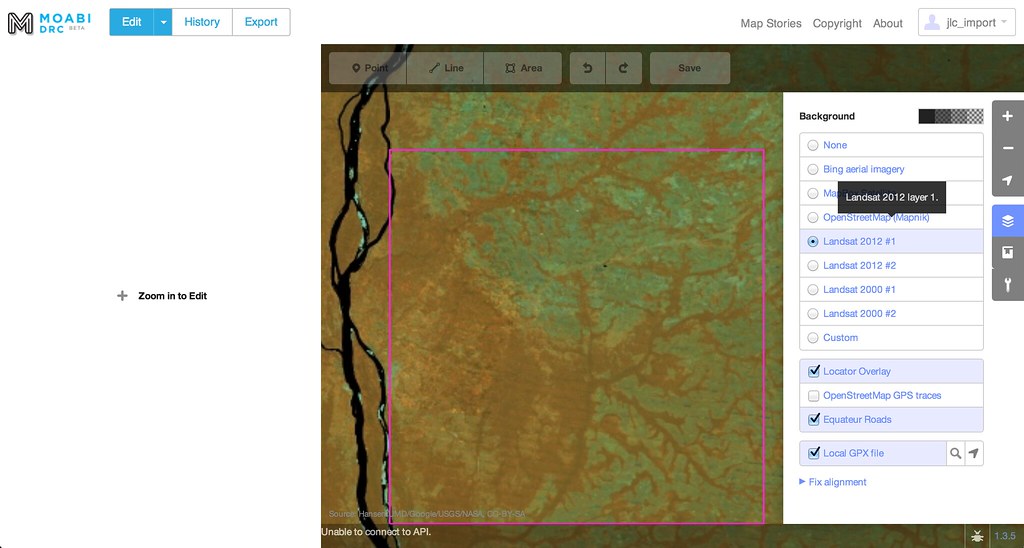
You have already seen the layers tab when adding your .gpx file. Open it again, and in the top radio-button box, experiment with changing the base layer. A handful of different satellite layers are available, some with time stamps.

In layers tab, below the baselayer box, there are also checkboxes for data layers. Toggle the Equateur Roads overlay to view the roads layer we will be digitizing.
The Equateur Roads layer displays WRI in OSM roads in orange. Logging roads are orange with a dashed stroke. OSM roads are white. **We are interested in tracing the following:
-
WRI logging roads not in OSM (orange, dashed line)
-
WRI logging roads already in OSM (white line overlaying an orange, dashed line), and
-
WRI non-logging roads not in OSM (orange, solid line)
A note on editing: because Moabi hosts such large amounts of data, and in order to be editable, all on-screen features need to be loaded into the browser. For this reason, it is only possible to edit data at zoom level 14 or higher. If the point, line, area buttons at the top are an opaque black, you are not zoomed in far enough to edit.

Find an area and zoom into the map , or click Zoom to Edit on the left.
Editing in iD
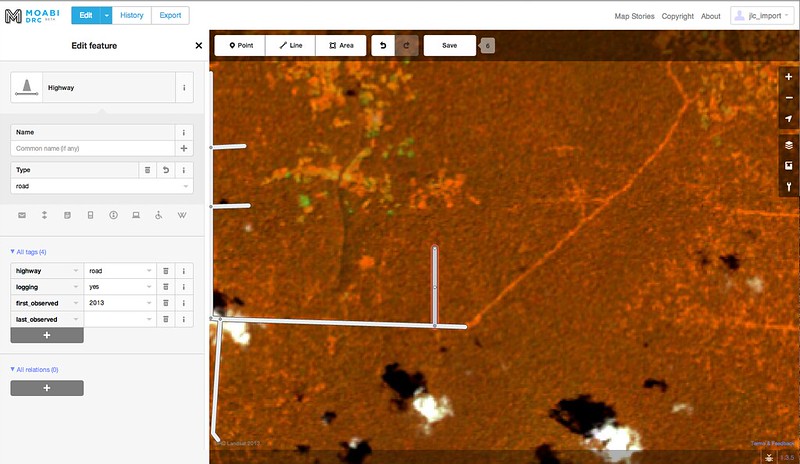
For this tutorial, everything we will be digitizing are lines–it is also possible to add points and polygons. Click the line button and add start tracing.
-
Click the map to add a new point to the multi-line, and click the final point again to complete tracing.
-
When your trace is complete, add the correct attributes. From the available attribute list, click Road, choose Unclassified, and, if it’s a logging road, assign logging the value of yes.
-
Next, if it is a logging road, date the image. Open up the layers tab again and change the base layer between different timestamped satellite layers. If the road is visible one year and not visible the previous year, assign first_observed to the year of that satellite layer. Next, do the same to find when (or if) the road was abandoned and disappeared. If the road is visible one year and visible the next year, assign last_observed to the year of that satellite layer. It is possible that one or both of these years will not be undeterminable; in that case, leave the tag blank.
-
Add another road, and continue tracing another feature inside your area of interest.

Closing a Task
When you have successfully mapped an entire grid cell, go back to the tasking manager and click the green Mark the Task as Done button. Add any comments on the data (for example, irregularities or inconsistencies).
You have successfully uploaded data to the Moabi OSM server. Congratulations! If you feel up for it, choose another cell.